The Role of Evaluation Metrics in the ML Lifecycle
Provide a constructive feedback mechanism
Offer objective criteria to assess predictive ability
Provide crucial direction for improvements
Align models performance with business objectives
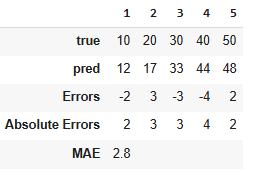
Mean Absolute Error (MAE)
Description
Error = absolute differences between actual and predicted values
- Measures the average magnitude of errors in predictions
Treats every error equally, regardless of size
- An error of 10 is penalized twice as much as an error of 5
- Extreme values do not disproportionately influence the metric
Intuitively understandable
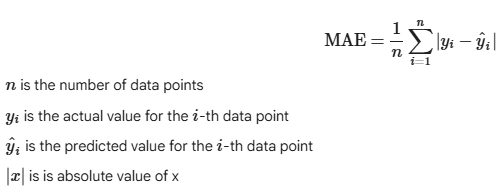
- MAE of 5 means, on average, predictions are off by 5 units from true values
Example use case delivery time estimates
- Extreme delays are expected but shouldn't skew the metric
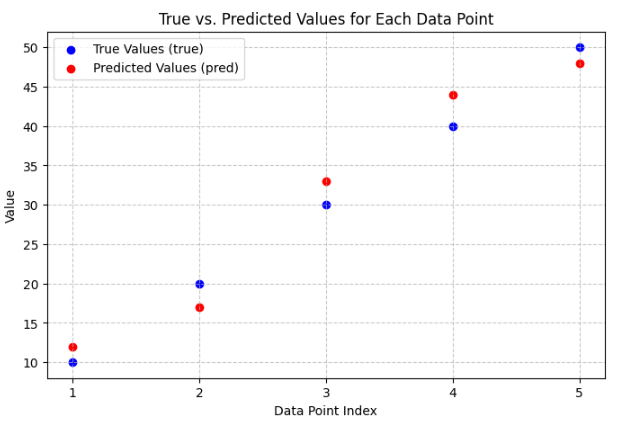
Data

Mathematical Definition
Calculation
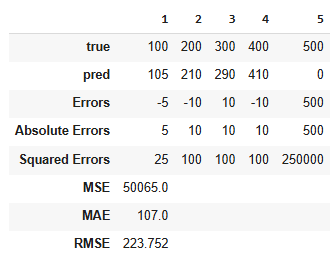
Mean Squared Error (MSE) and Root MSE (RMSE)
Description
Error = squared differences between actual and predicted values
- MSE: average magnitude of squared errors in predictions
- RMSE: Square root of MSE
Sensitivity to Outliers
- Penalizes large errors
- An error of 10 is penalized four times as much as an error of 5
- Extreme values disproportionately influence the metric
Interpretability
- MSE not intuitively understandable (due to squared unit)
- RMSE better (due to same unit as values)
Example use case energy consumption
- Extreme high energy demand should not disrupt systems
Data
Mathematical Definition
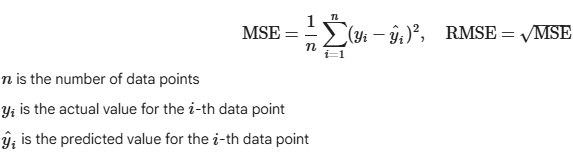
Calculation
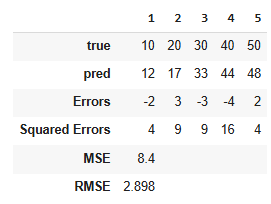
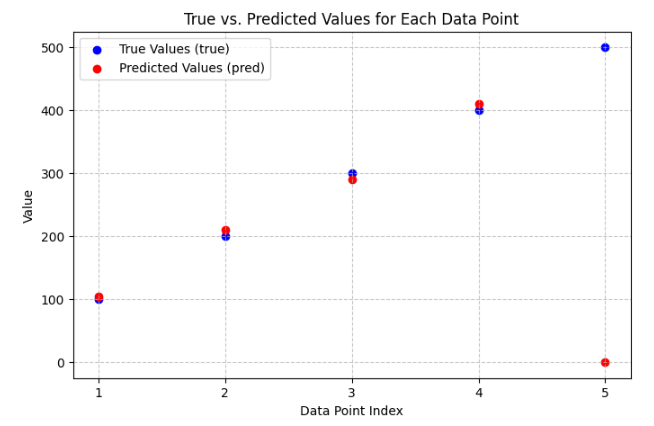
MAE vs. RMSE
Description
MAE treats all errors equally
RMSE heavily penalizes large errors due to squaring residuals
The true value is revealed when used together
Low MAE but a high RMSE
Few severe, high-impact prediction errors
Outlier detection, data preprocessing
Data
Calculation
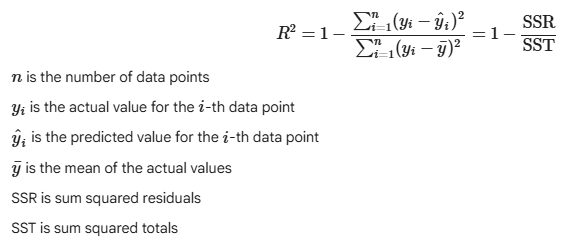
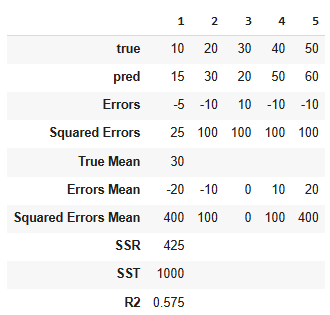
R2
Description
Proportion of variance of true values that is explained by predictions
Goodness of fit
Sensitive to outliers
Interpretation
- Best possible value is 1
- Values close to 1 indicate strong fit
- Can be negative if model gets arbitary worse
- Simple model predicting average of true values get R2 of 0
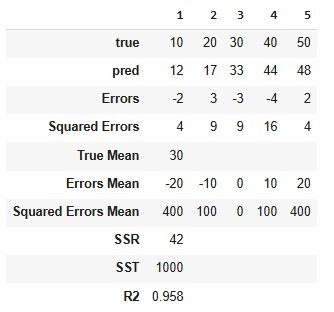
Data
Mathematical Definition
Calculation
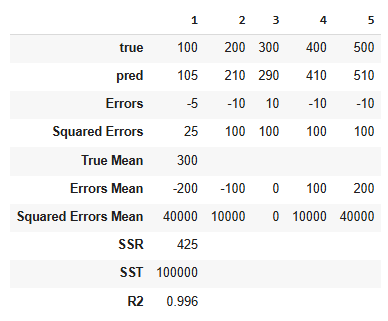
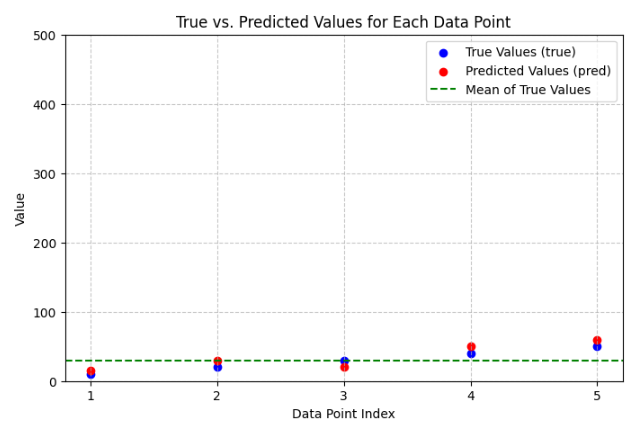
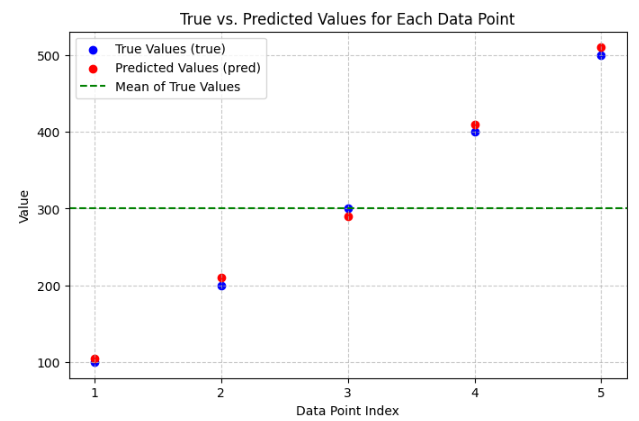
Dependency of R2 on Mean of True Values
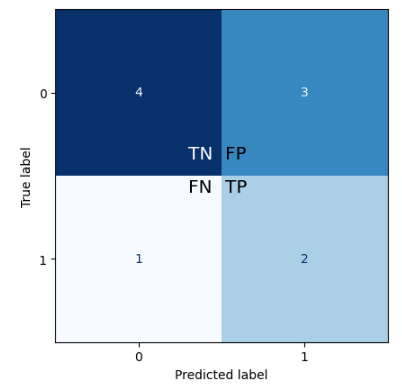
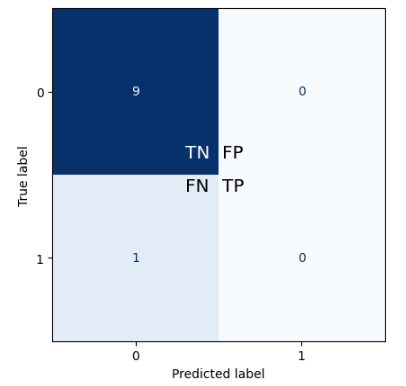
Confusion Matrix - Binary Case
Description
Tabular view how predictions align with true values (2x2 matrix)
Based on classes and labels
- Positive class (e.g. email is spam) - label: 1
- Negative class (e.g. email is regular) - label: 0
Four alternatives
- True Positives (TP): Model correctly predicted the positive class
- True Negatives (TN): Model correctly predicted the negative class
- False Positives (FP): Model incorrectly predicted the positive class
when true value was of negative class - False Negatives (FN): Model incorrectly predicted the negative class
when true value was of positive class
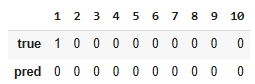
Data
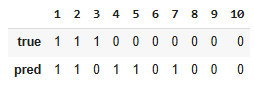
1, 2: was spam - predicted as spam (TP)
3: was spam - predicted as regular (FN)
4, 5, 7: was regular - predicted as spam (FP)
6, 8, 9, 10: was regular - predicted as regular (TN)
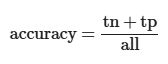
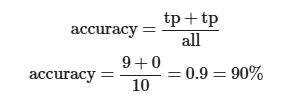
Accuracy
Description
Fraction of correctly classified cases
Values between 0 an 1
Data
Mathematical Definition
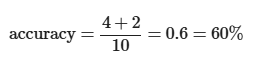
Calculation
Problems with Imbalanced Data Sets
Dummy classifier (always predict 0) completely useless
Assume cancer - dummy classifier would have 99.999% accuracy
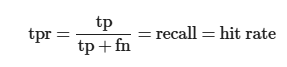
Recall
Description
Classifiers ability to capture all positive cases
Of all true positive cases, how many are identified, ie. predited as 1
Minimizing FN
Usage when cost of FN is extremely high
- Missed cancer diagnosis
- Missed security threat detection
Data
Mathematical Definition
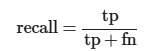
Calculation
Handling of Imbalanced Data Sets
Dummy classifier (always predict 0) gets very bad recall, ie. 0
Doesn't capture a single positive instancey
Precision
Description
Of all positive predicted cases, how many are actually positive
Minimizing FP
Usage when cost of FP is extremely high
- Regular mail classified as spam
- Legitimate financial transaction clssified as fraudulent
Data
Mathematical Definition
Calculation
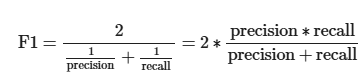
F1
Description
Balance between precision and recall
- Easy to get high recall: just predict positive
- Leads to 100% recall but bad precision
- Easy to get high precision: only predict best instance as positiv
- Leads to 100% precision but bad recall
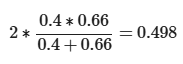
Calculate mean between recall and precision
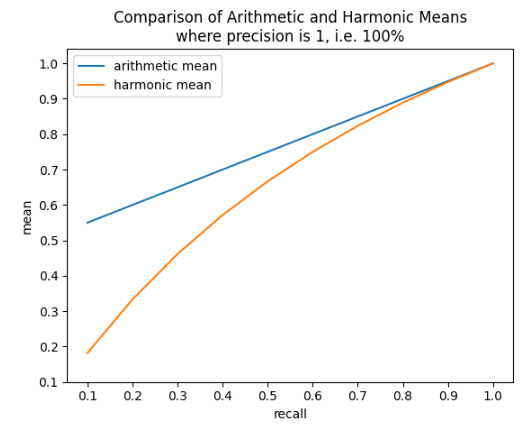
- Arithmetic mean not a good choice
- Precision of 100% and recall of 1% would lead to F1 of 50.5%
- Would be too good F1 for such a bad classifier
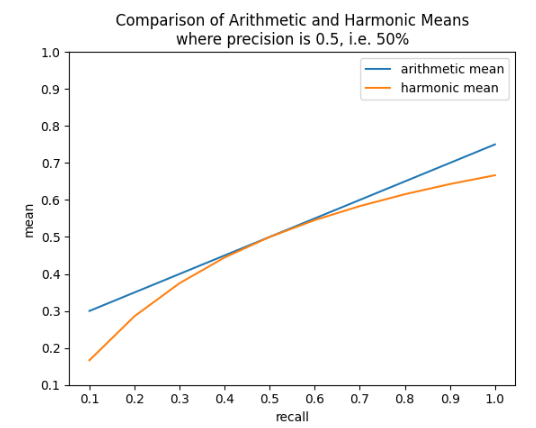
- Better harmonic mean
Suitable for imbalanced data
Better evaluation of minority class than accuracy
Data
Mathematical Definition
Calculation
Arithmetic Mean vs Harmonic Mean
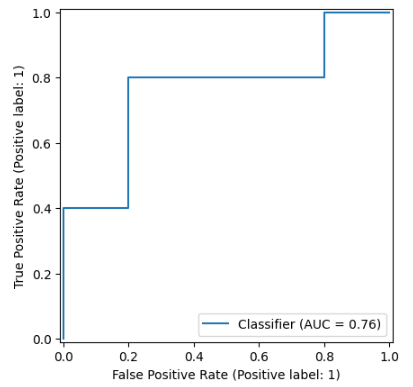
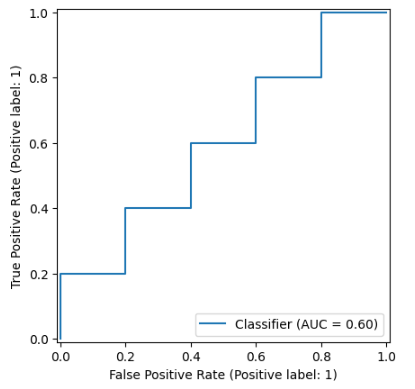
ROC / AUC
Description
ROC = Receiver Operating Characteristic
AUC = Area Under Curve
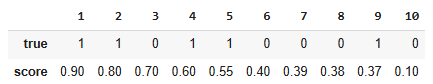
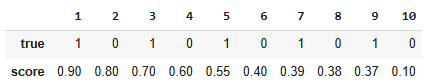
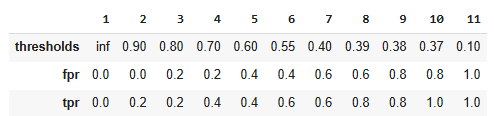
Based on scoring classifier
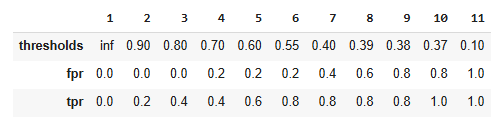
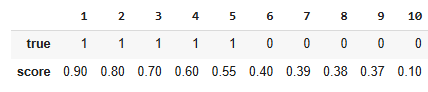
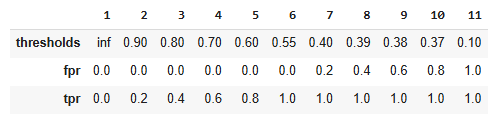
Data
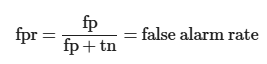
False Positive Rate vs True Positiv Rate
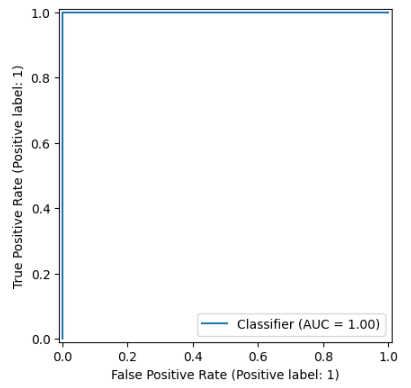
Ideal Classifier
Random Classifier
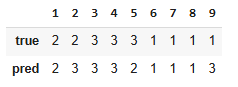
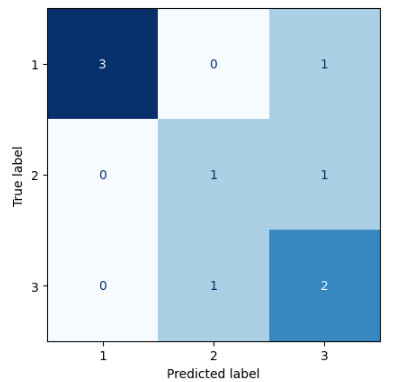
Confusion Matrix - Multiclass Case
Data
Classification of newspaper articles
1: bus - business
2: pol - politics
3: spo - sports
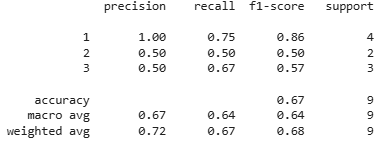
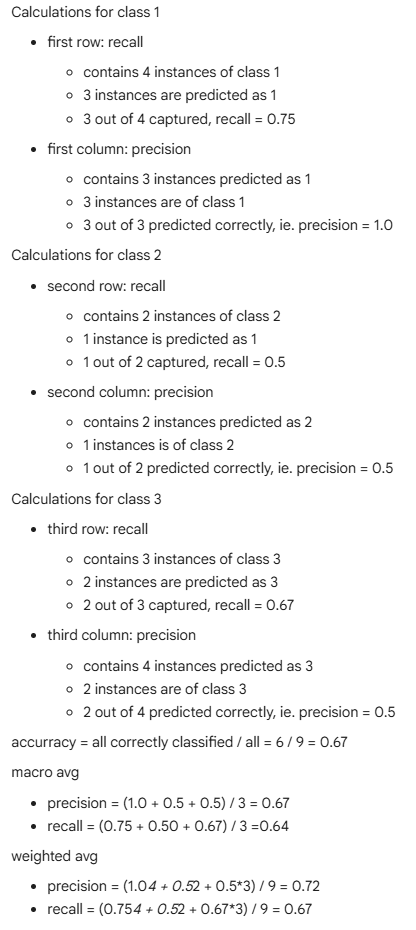
Classification Report