Attribution
The following slides are based on
- Fundamentals of Data Visualization (link)
and are following the - Attribution-NonCommercial-NoDerivatives 4.0 International License (link)
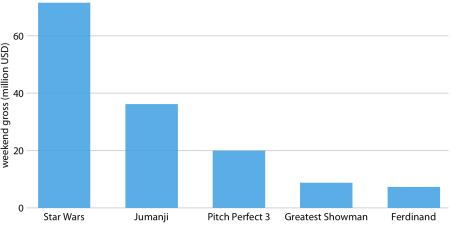
Bar Charts
Magnitudes of amounts
Comparison of amounts
Quantitative values per categorie
Values must start at zero
Common problem: labels too long
Rotated Label
Not optimal
Actually, matter of taste

Horizontal Bar Charts
Better solution in case of long labels
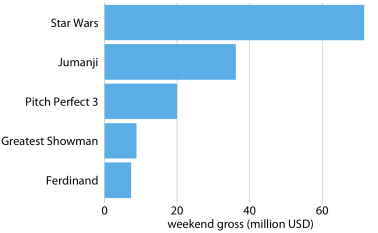
Natural Order on Labels
In this case the sorting according to labels is sensible
Sorting according to values would prevent insights

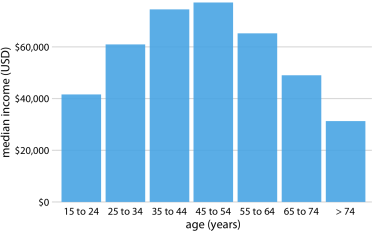
Grouped Barchars
Amounts for more than one Category
Demographics per Age Bands

Age Bands per Demographics
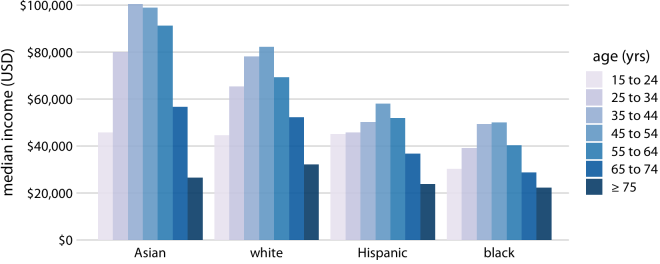
Grouped Bar Plots
Here Age Bands per Demographics
No color coding necessary

Stacked Barchars
Totals for items of one category recognizable
Here per cabin class

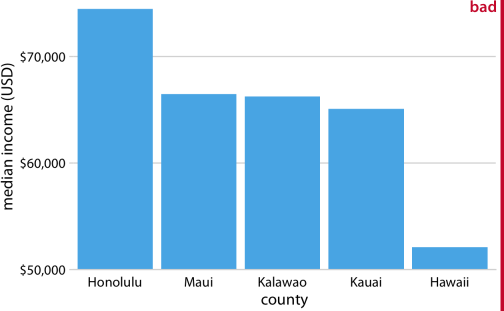
Wrong Usage of Bar Chart
Bar chart that doesn't start at 0
Biased presentation
Differences seem to be greater than they are
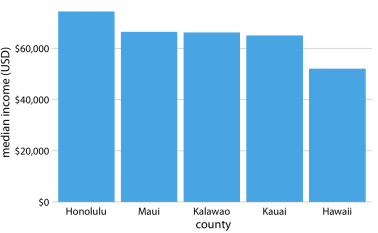
Start at 0
Unbiased Presentation
Dot Plots
Barcharts must start at zero
Might hinder comprehension
Might disguise diferences. Differences seem to be small

But small differences in life expectancy might be important
Dot plots must not start at zero

Heatmaps
Large number of categories/combinations
Barchart not suitable
Here sorting according to amount in 2016
