Attribution
The following slides are based on
- Fundamentals of Data Visualization (link)
and are following the - Attribution-NonCommercial-NoDerivatives 4.0 International License (link)
Association of two quantitative Variables
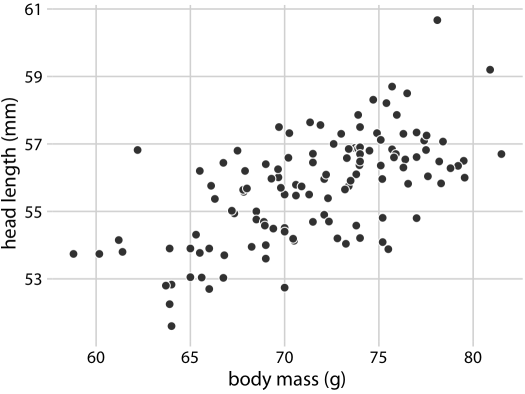
Scatter Plot
Here headlength and wight of birds
The heavier the bird, the longer the head, roughly
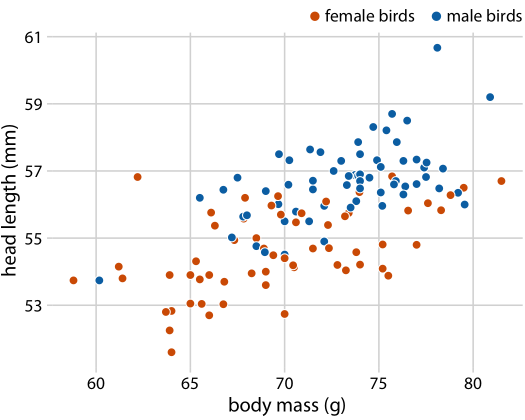
Additional visual clue via color: sex
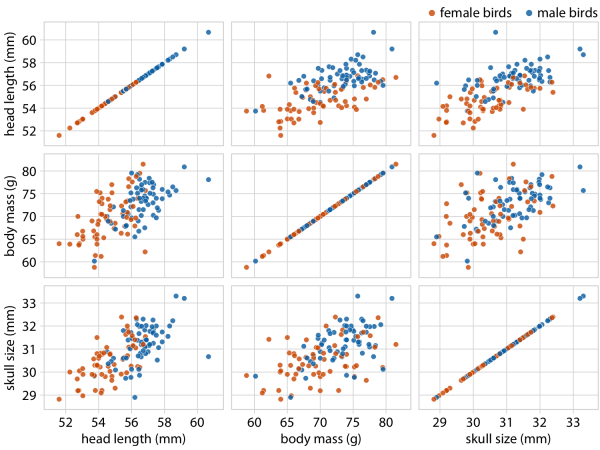
Further information via dot size: skull size

Pairwise Association of many quantitative variables
Matrix of Scatter Plots
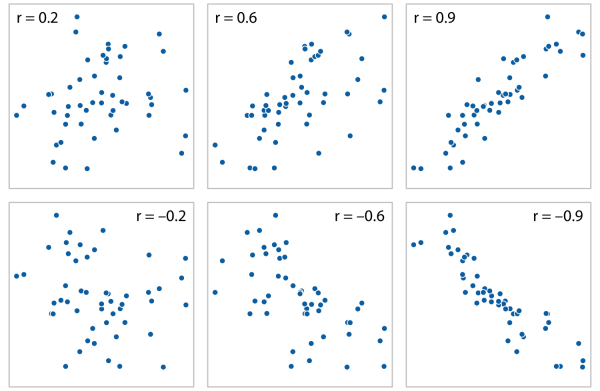
Correlation
Correlation coefficient
+/-0.2: weak
+/-0.6: medium
+/-0.9: strong
Heatmap, actually, correlogram due to symmetry
Here mineral content of glass fragments

Magnesium negatively correlated with nearly all others
Aluminum positively correlated with barium
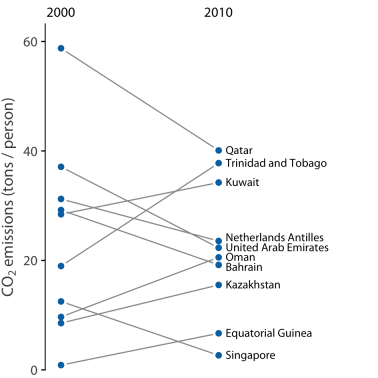
Association of few Data Points
Slopegraph
Two measurements
Three measurements
